How your money is spent

Your rent helps provide services including maintaining your home and more.

Last year (2023/24) we spent £338 million on our rented homes, which is split like this:

Repairs

£102m repairs

This included £56m carrying out over 230,000 responsive repairs, £31m on gas servicing, fire risk assessments and other safety checks. And £15m on major repair works.

House icon with colour

£73m housing management (Total)

This relates to the day to day costs of running the organisation as well as providing services to customers.

It includes £40m of employment costs for our colleagues working in housing services and our back office functions.

Other significant costs include £7m on IT equipment and systems, and £5m on insurance.

Chart money icon

£53m depreciation

Depreciation is the decrease in the value of an asset over time (in our case, the "assets" are houses or other buildings). This decrease in value is recorded as an expense every year in our accounts.

Bar money chart icons

£55m interest payments

Interest is a charge we pay to our lenders (banks) to borrow money that we use to build homes.

In 2023/2024 we made a surplus of £23 million. We reinvest our surplus back into the business where it helps pay for things like this:

  • Improvements to our existing homes – we invested £50 million last year
  • Building new affordable homes for rent – we invested £101 million last year

Making a surplus is important as it:

  • Gives us financial stability
  • Lets us invest

Want to know more?

If you want to know the detail behind our finances then read our financial statements. Our customers shape everything we do. Find out how you can get involved in how your money is spent.

How much money do we receive, and where do we spend it?

What we do:Renting homesBuilding homes to sellProviding care and support and other activitiesOther activitiesTotal
Income (£m)35288487494
Costs (£m)-338-83-45-9-486
Other (£m)-6-915
Surplus (£m)13113-423
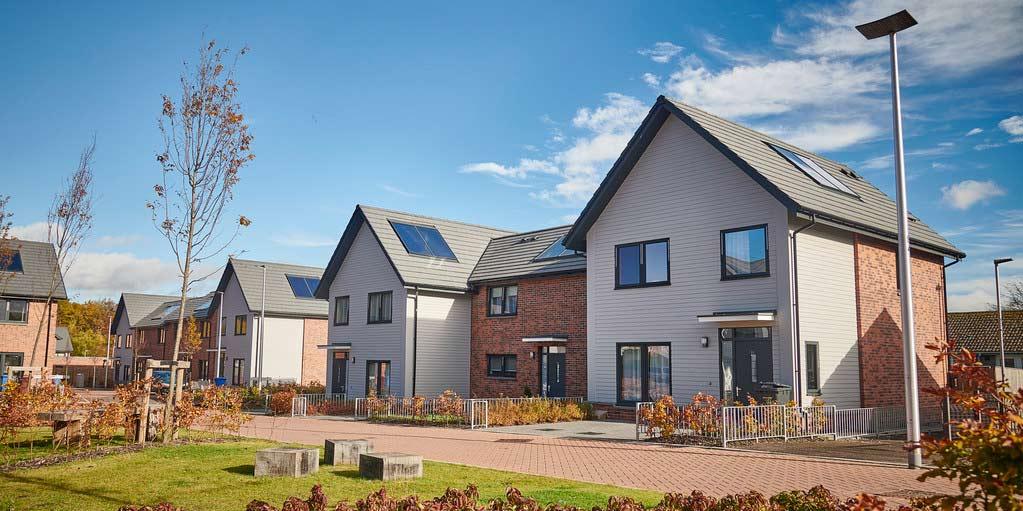
Housing estate.

How do we fund development of new homes?

We spent £187 million on building new homes last year:

Approximately 25% of a new affordable home is funded through a grant from the government and Home Group funds the rest.

We do this by reinvesting the surplus we make on the homes we build to sell, or borrowings that we then pay back from the rental income we receive.

Colleagues talking over surface pros

Directors’ remuneration and management costs

The regulator requires us to provide information about our directors’ remuneration – what we pay our executive directors and board members – and the management costs of running the business.

We paid our executive directors and independent board members a total of £1.5m last year. This represents £28.22 per home. Our Chief Executive was paid a total of £263,000, or £5.06 per home.

In 2023/24 we spent £71m on housing management of social housing. As well the direct costs of managing customers’ homes, this includes the day to day costs of running the business, including back office costs such as running our offices and IT systems.

Management costs represent £1,368 per home. The average cost for the sector (in 2022/23) was £1,200.

Help us improve our website. Did you find this web page useful?

The information we receive from this form is anonymous. This means we can't get back in touch. If you need our help, please get in touch.